Introduction
The rapid cooking bean project (RCBP) is a collaborative project of The University of Western Australia (UWA), Alliance Bioversity International and CIAT, and national bean programmes in six partner countries (PCs) in east Africa (UGA, RWA, ETH, BDI, TZA, KEN) linked by the Pan African Bean Research Alliance (PABRA), and funded primarily through the Australian Centre for International Agricultural Research (ACIAR).
Objectives
1. Evaluate yield, adaptation and quality across six partner countries and Alliance Bioversity International and CIAT -Kawanda.
2. Select the best parents among an African common bean panel to be used for crossing so as to maximize future genetic progress for the benefit of all PC’s.
3. Optimize the analysis of genotype x environment interactions (GxE) for these traits which will help to identify the best parents for crossing.
4. Utilize the collected data to evaluate genomic breeding values for important traits.
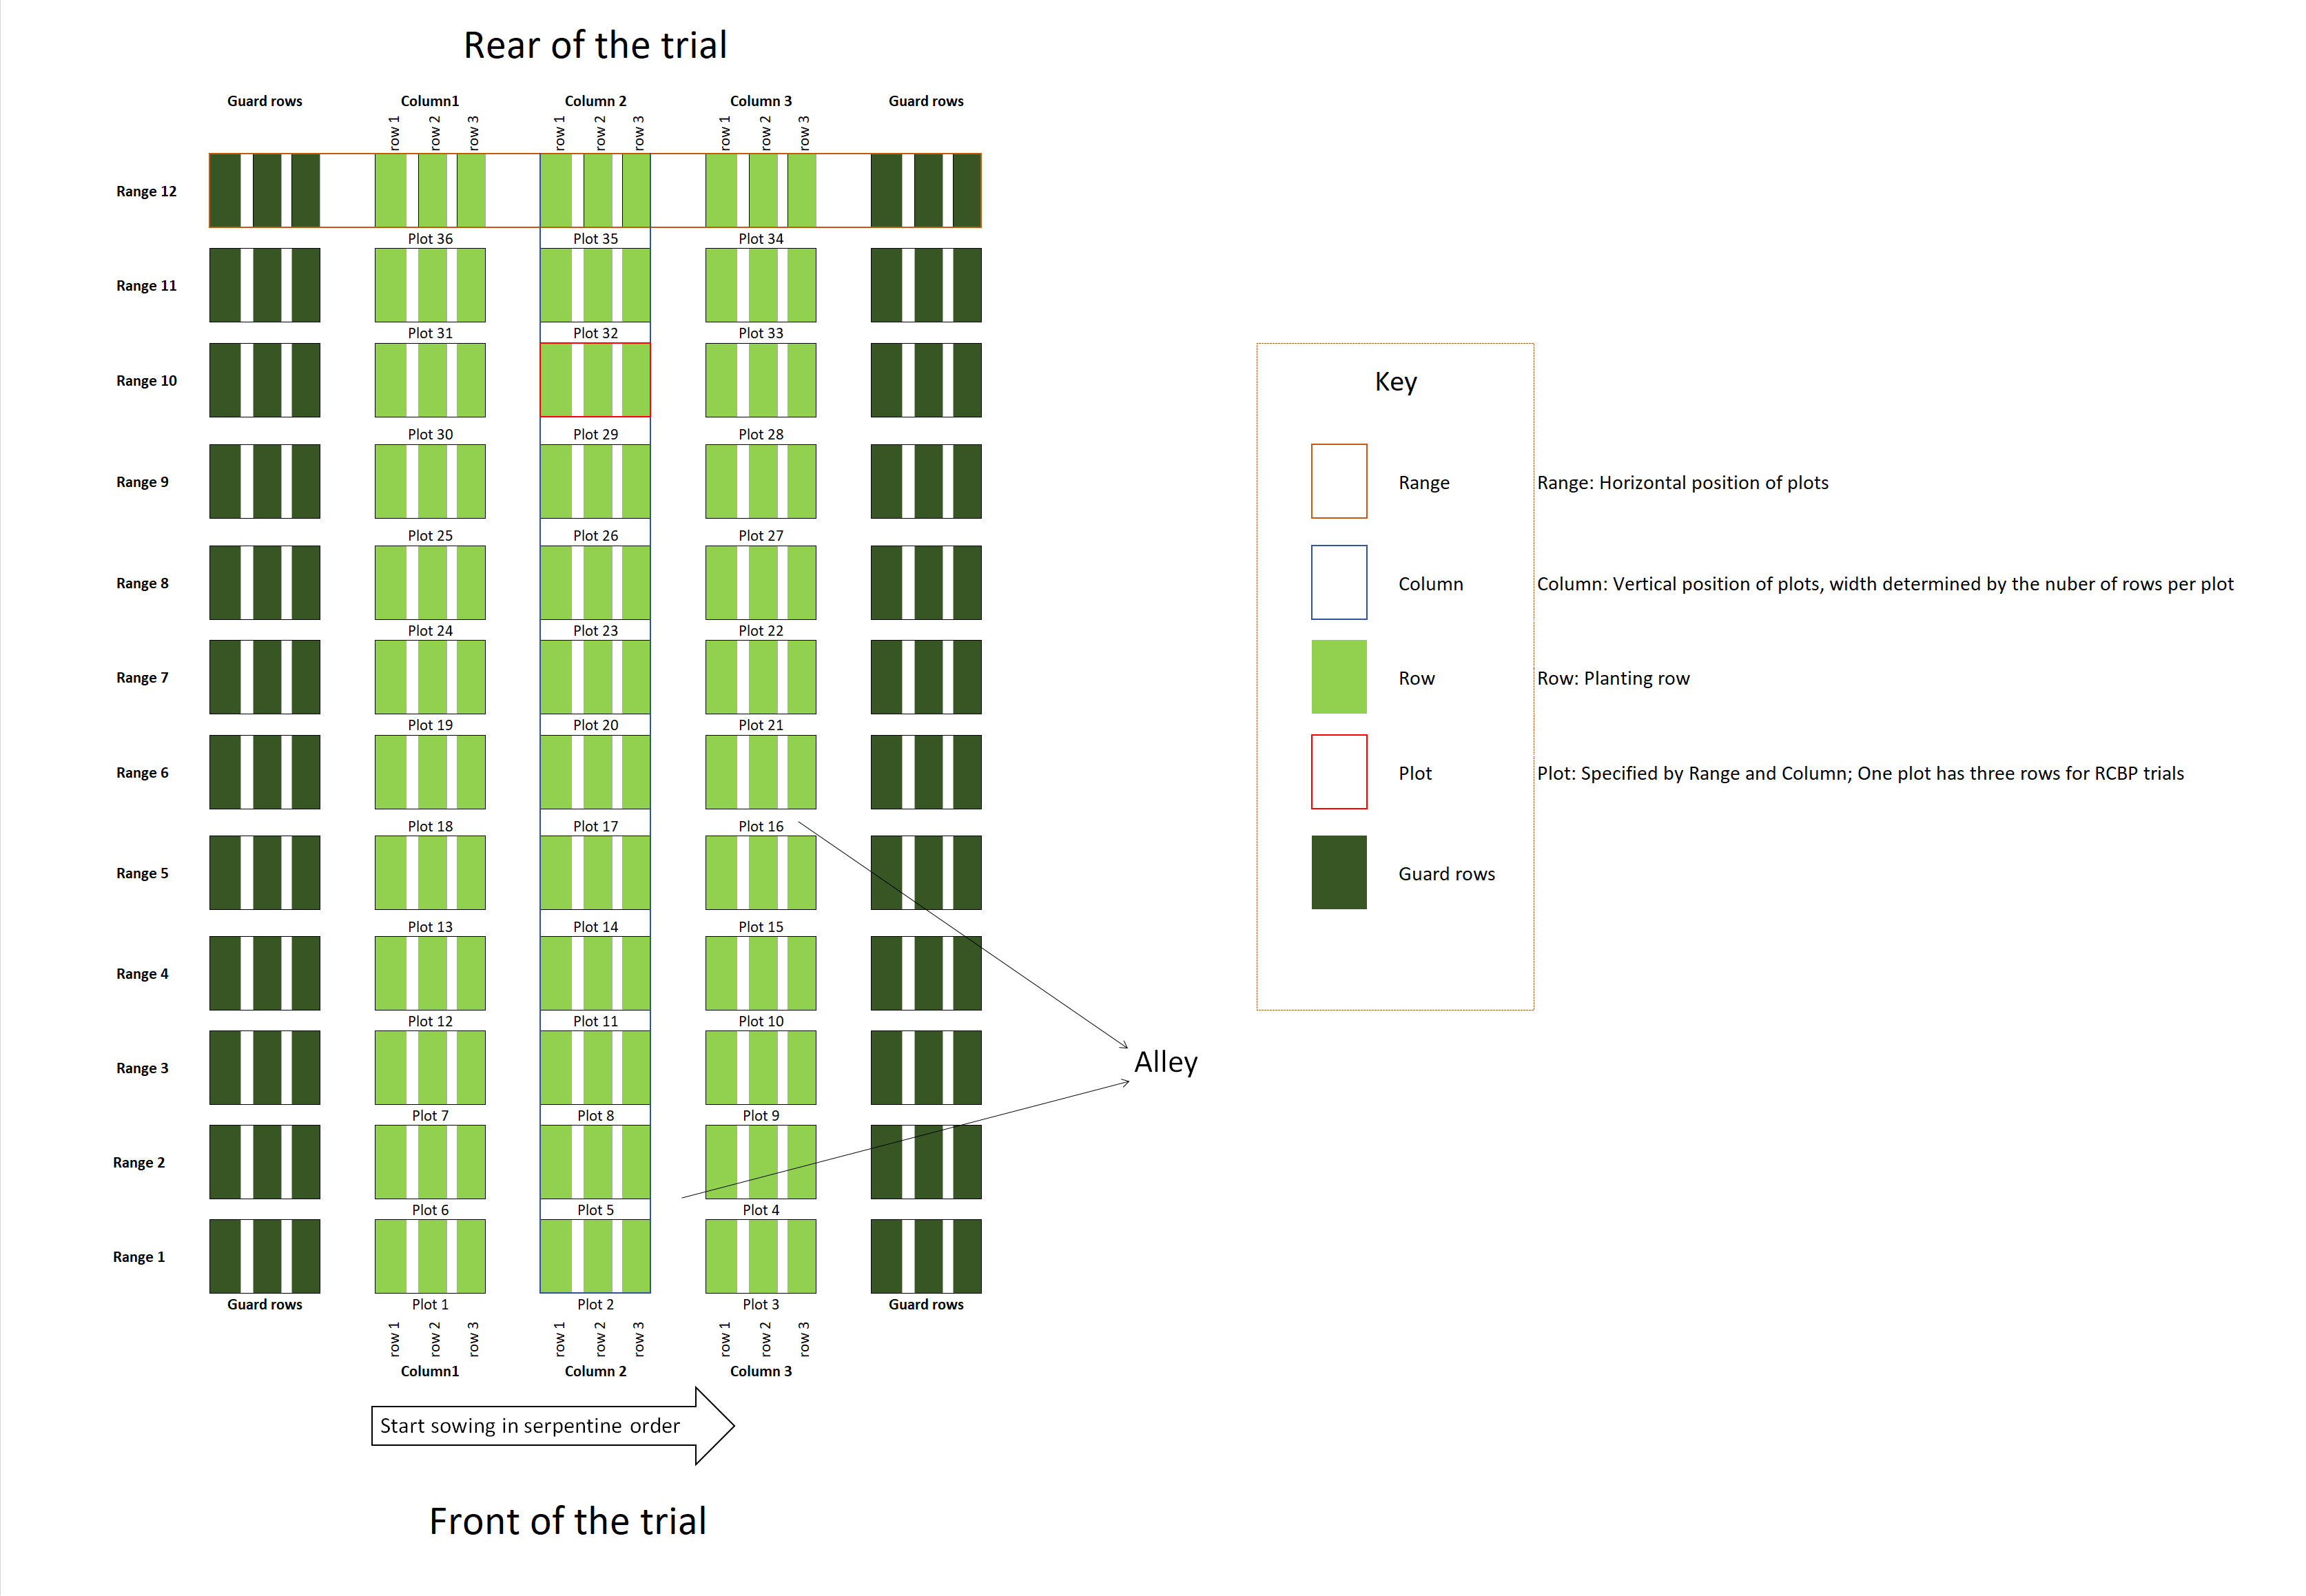
Trial design
Due to low seed amounts, trial design is partially replicated using DiGGer software at each site with some varieties in single replications and others in two replications. Not all varieties can be sown at every site. Local controls are added following your advice. There is a different design in each PC
Data Collection
Trial location data
- Name of trial site (village, district and nearest city)
- Altitude of trial site (meters above the sea level (m.a.s.l) measured with an altimeter; or by map position
- GPS location (latitude and longitude coordinates) measured with GPS, in degrees and minutes; or by map position
- Soil data: Texture, P, N, K, OM, pH, soil composition (% sand, silt, clay).
Management data
- Planting date
- Method of planting (manual or mechanical)
- Type of seed bed (flat or ridged)
- Frequency and type of weeding (manual, mechanical, or if herbicide then state the name of the herbicide frequency and rate of application)
- Frequency, type, and rate of pesticide application
- Timing and amount of irrigation if any
- Timing, amount, distribution, placement, and type of fertilizer
Weather data
- Daily minimum and maximum temperature (during crop growth period) Daily rainfall data (during crop growth period)
Crop response data
|
|
Name of Trait |
Abbreviated name |
Description of Trait |
Describe how measured (method) |
Growth stages |
Rating scale/units |
PC |
Comments |
|
|
Growth habit |
GH |
A qualitative description of the growth habit of the plant. |
Based on visual classification by categories (see appendix 2) |
R6,R7 |
1-5 |
All |
|
|
|
Days to flowering |
DF |
Number of days from planting to day when 50% of plants in plot have at least one flower |
Evaluated visually. See "Stages of development of the common bean plant". |
R6 |
days |
All |
|
|
|
Halo blight on leaves in field |
HBFL |
Disease reaction to Pseudomonas on leaves; field |
Quantification of symptom development; Flowering (R6) (see appendix 2) |
R6 |
1-9 |
All |
|
|
|
Rust on leaves in field |
RUSTFL |
Disease reaction to Uromyces phaseoli on leaves; field |
Quantification of symptom development; Flowering (R6) (see appendix 2) |
R6 |
1-9 |
All |
|
|
|
Days to physiological maturity |
DPM |
Number of days from planting to day when the first pod begins to discolor in 50% of the plants. |
Evaluated visually. See "Stages of development of the common bean plant". |
R9 |
days |
All |
|
|
|
Number of plants per effective plot area |
PLPLOT |
Number of plants per effective plot area |
Number of plants in effective plot after discarding 0.5 meter from each end of the plot |
Normally at harvest |
number |
All |
|
|
|
Pods per plant |
PDPL |
Number of pods counted per plant grown in a pot or the field |
Average number of pods from 5 to 10 randomly selected plants |
R9, Harvest |
number |
All |
|
|
|
Seeds per pod |
SDPD |
Number of seeds per pod |
Average number of seeds/pod in 10 pods, one from each of 5-10 randomly selected plants |
R9, Harvest |
number |
All |
|
|
|
Seed production per effective plot |
GMPLOT |
Weight of seed produced in the effective plot area (g) |
Weight (g) of seed harvest (at 13% moisture content) from all plants in the effective plot area |
Harvest |
g |
All |
Seed moisture content should be 13% |
|
|
Yield per plant |
YDPL |
Average yield per plant in effective plot area |
Total yield of effective plot (GMPLOT) divided by number of plants in effective plot area |
Harvest |
g |
All |
Calculated from GMPLOT |
|
|
Yield per hectare |
YDHA |
Estimation of yield per hectare (kg/ha) |
Weight (kg) of seed harvest divided by effective plot area in m2 and multiplied by 10. |
Harvest |
kg/ha |
All |
Calculated from GMPLOT |
|
|
Seed weight |
100SW |
Weight of 100 seeds (g) |
100 seeds (at 13% moisture content) are weighed on an analytical scale |
Harvest or later |
g |
All |
Seed moisture content should be 13% |
|
|
Pythium spp. in field |
PYTHF |
Disease reaction to Pythium spp; field |
Quantification of symptom development; Emergence (V1), Flowering (R6); Pod Formation (R7), Pod filling (R8). |
V1,R6,R7,R8 |
1-9 |
KEN |
|
|
|
Bean Common Mosaic Necrosis Virus |
BCMNV |
Reaction to viral infection |
Evaluated as mosaic (M); necrotic (N); asymptomatic (O), local lesions (L) or variable (V). (see appendix 2) |
R5-R7 |
1-5 |
UGA RWA BDI |
|
|
|
Bean Stem Maggot |
BSM |
Reaction to Ophiomyia spp |
Measured on 1 to 9 scale (see appendix 2). Evaluation Third trifoliate leaf (V4). |
V4 |
1-9 |
ETH UGA |
|
|
|
Angular Leaf Spot on leaves in field |
ALSF |
Disease reaction to P. griseola on leaves; field |
Quantification of symptom development; Flowering (R6). (see appendix 2) |
R6 |
1-9 |
RWA BDI |
|
|
|
Angular Leaf Spot on pods in field |
ALSFP |
Disease reaction to P. griseola on pods; field |
Quantification of symptom development; Pod filling (R8). |
R8 |
1-9 |
RWA BDI |
|
|
|
Anthracnose on leaves in field |
ANTFL |
Disease reaction to C. lindemuthianum on leaves; field |
Quantification of symptom development in leaves; Flowering (R6). (see appendix 2) |
R6 |
1-9 |
KEN |
|
|
|
Anthracnose on pods in field |
ANTFP |
Disease reaction to C. lindemuthianum on pods; field |
Quantification of symptom development in pods; Pod Formation (R7), Pod filling (R8). (see appendix 2) |
R7,R8 |
1-9 |
KEN |
|
|
|
Common Bacterial Blight on leaves in field |
CBBFL |
Disease reaction to Axonopodis on leaves; field |
Quantification of symptom development; Flowering (R6). (see appendix 2) |
R6 |
1-9 |
UGA |
|
|
|
Common Bacterial Blight on pods in field |
CBBFP |
Disease reaction to Axonopodis on pods; field |
Quantification of symptom development; Pod Formation (R7), Pod filling (R8). (see appendix 2) |
R7,R8 |
1-9 |
UGA |
|
|
|
Bruchid damage |
BRU |
Quantification of bruchid damage on seed |
Adult emergence from seed as percentage of egg count |
Post Harvest |
% |
ETH UGA |
|
|
|
Fusarium solani in field |
FUSRRF |
Disease reaction to Fusarium solani; field |
Quantification of symptom development; Emergence (V1), Flowering (R6); Pod Formation (R7), Pod filling (R8) (see appendix 2) |
V1,R6,R7,R8 |
1-9 |
KEN |
|
|
|
Seed Zinc |
ZNSEED |
Zinc content in seed |
Measured by XRF methods in ppm |
Post Harvest |
ppm |
RWA CIAT-Kw |
|
|
|
Seed Iron |
FESEED |
Iron content in seed |
Measured by XRF methods in ppm |
Post Harvest |
ppm |
RWA CIAT-Kw |
|
|
|
Cooking time |
COOKT |
Time taken for 96 to100% of grain to reach soft texture |
Measured by Mattson cooker in minutes |
Post Harvest |
minutes |
CIAT-Kw |
|
|
|
Low soil fertility |
This is often done by setting the trail in poor soils (low P, N or high Al) and observing the root development and plant development and finally the yield parameters. |
TZA BDI |
|||||
|
|
Number of effective nodules |
NENBB/ NENCB |
Quantity of nodules of Rhizobium spp. in the plant |
It is expressed as the number of effective nodules (red or pink) per plant (see appendix 2) |
R6 |
1-9 |
BDI |
Rating Scale
|
Trait # |
Name of Trait |
Abbreviated name |
Rating scale |
Scale Description |
|
|
Growth habit |
GH |
1-5 |
1=Determinate bush |
|
2=Indeterminate bush habit, erect stems and branches |
||||
|
3=Indeterminate bush habit with weak main stem and prostrate stem and branches |
||||
|
4=Indeterminate climber habit with weak, long and twisted stem and branches |
||||
|
5=Determinate climber |
||||
|
|
Angular Leaf Spot on leaves in field |
ALSF |
1-9 |
1= No visible disease symptoms |
|
2= Unspecified intermediate values correspond to intermediate percentages of affected areas |
||||
|
3= Presence of a few small non-sporulating lesions that cover approximately 2% of the leaf surface area, |
||||
|
4= Unspecified intermediate values correspond to intermediate percentages of affected areas |
||||
|
5= Presence of several small lesions with limited sporulation that cover approximately 5% of the leaf surface area |
||||
|
6= Unspecified intermediate values correspond to intermediate percentages of affected areas |
||||
|
7= Abundant and generally large sporulating lesions that cover approximately 10% of the leaf surface area. On the foliage, the lesions may coalesce to produce larger infected areas associated with chlorotic tissue. Lesions may also be found on the stem an* |
||||
|
8= Unspecified intermediate values correspond to intermediate percentages of affected areas |
||||
|
9= 25% or more of the leaf surface area is covered by large sporulating and often coalescing lesions. Leaf tissues are generally chlorotic resulting in severe and premature defoliation. Abundant sporulating lesions are present on stem and branches |
||||
|
|
Angular Leaf Spot on pods in field |
ALSFP |
1-9 |
1= No visible disease symptoms |
|
2= Unspecified intermediate values correspond to intermediate percentages of affected areas |
||||
|
3= Presence of a few small non-sporulating lesions that cover approximately 2% of the pod surface area |
||||
|
4= Unspecified intermediate values correspond to intermediate percentages of affected areas |
||||
|
5= Presence of several small lesions with limited sporulation that cover approximately 5% of the pod surface area |
||||
|
6= Unspecified intermediate values correspond to intermediate percentages of affected areas |
||||
|
7= Abundant and generally large sporulating lesions that cover approximately between 10% and 20% of the pod surface area |
||||
|
8= Unspecified intermediate values correspond to intermediate percentages of affected areas |
||||
|
9= 50% or more of the pod surface area is covered by large sporulating and often coalescing lesions. Infected pods are often deformed and shrivelled and contain a low number of seeds |
||||
|
|
Anthracnose on leaves in field |
ANTFL |
1-9 |
1= No visible disease symptoms 2= Unspecified intermediate values correspond to intermediate percentages of affected areas 3= Presence of very few and small lesions mostly on the primary vein of the leaf's lower side that cover approximately 1% of the surface area 4= Unspecified intermediate values correspond to intermediate percentages of affected areas 5= Presence of several small lesions on the petiole or on the primary and secondary veins of the leaf's lower side that cover approximately 5% of the leaf surface area 6= Unspecified intermediate values correspond to intermediate percentages of affected areas 7= Presence of numerous enlarged lesions on the lower side of the leaf. Necrotic lesions can be observed on the upper leaf surface and on the petioles that cover approximately 10% of the leaf surface area 8= Unspecified intermediate values correspond to intermediate percentages of affected areas 9= Severe necrosis on 25% or more of the plant tissue including lesions on the leaf, petioles, stem, branches and even on the growing point which often results in death of much of the plant tissues |
|
|
Anthracnose on pods in field |
ANTFP |
1-9 |
1= No visible disease symptoms 2= Unspecified intermediate values correspond to intermediate percentages of affected areas 3= Presence of very few and small lesions that cover approximately 1% of the pod surface area 4= Unspecified intermediate values correspond to intermediate percentages of affected areas 5= Presence of several small round lesions (less than 2 mm in diameter), with sporulation that cover approximately 5% of the pod surface area 6= Unspecified intermediate values correspond to intermediate percentages of affected areas 7= Presence of medium-sized (larger than 2 mm in diameter) lesions are evident but also some small and large lesions generally with sporulation and that cover approximately between 10% and 20% of the pod surface area 8= Unspecified intermediate values correspond to intermediate percentages of affected areas 9= Presence of numerous, large, sporulating, sunken cankers that cover approximately 50% or more of the pod surface area and that can result in pod malformation, low seed number, and death of the pod |
|
|
Bean Stem Maggot |
BSM |
1-9 |
1= Infested plants are as vigorous as uninfested plants. The bean fly apparently causes no considerable damage 2= Unspecified intermediate values correspond to intermediate stages of damage 3= Infested plants with slight growth delay 4= Unspecified intermediate values correspond to intermediate stages of damage 5= Infested plants with considerable growth delay 6= Unspecified intermediate values correspond to intermediate stages of damage 7=Infested plants with severe growth delay 8= Unspecified intermediate values correspond to intermediate stages of damage 9= Infested plants dead or almost dead |
|
|
Common Bacterial Blight on leaves in field |
CBBFL |
1-9 |
1= No visible disease symptoms 2= Unspecified intermediate values correspond to intermediate percentages of affected areas 3= Presence of a few small lesions that cover approximately 2% of the leaf surface area 4= Unspecified intermediate values correspond to intermediate percentages of affected areas 5= Approximately 5% of the leaf surface area covered by small lesions that are beginning to coalesce and sometimes encircled by yellow halos resulting in minor blight 6= Unspecified intermediate values correspond to intermediate percentages of affected areas 7= Approximately 10% of the leaf surface area covered with medium and large lesions which are usually accompanied by yellow halos and necrosis 8= Unspecified intermediate values correspond to intermediate percentages of affected areas 9= 25% or more of the leaf surface area is covered by large coalescing and g |
|
|
Common Bacterial Blight on pods in field |
CBBFP |
1-9 |
1= No visible disease symptoms 2= Unspecified intermediate values correspond to intermediate percentages of affected areas 3= Presence of a few small lesions that cover approximately 2% of the pod surface area 4= Unspecified intermediate values correspond to intermediate percentages of affected areas 5= Approximately 5% of the pod surface area covered by small and not coalescing lesions 6= Unspecified intermediate values correspond to intermediate percentages of affected areas 7= Approximately 10% of the pod surface area is covered by large and coalescing lesions and often show bacterial exudate 8= Unspecified intermediate values correspond to intermediate percentages of affected areas 9= 25% or more of the pod surface area is covered by large coalescing lesions that |
|
|
Fusarium solani in field |
FUSRRF |
1-9 |
1= No visible disease symptoms 2= Unspecified intermediate values correspond to intermediate percentages of damage 3= Light discoloration either without necrotic lesions or with approximately 10% of the hypocotyl and root tissues covered with lesions 4= Unspecified intermediate values correspond to intermediate percentages of damage 5= Approximately 25% of the hypocotyl and root tissues covered with lesions but tissues remain firm with deterioration of the root system. Heavy discoloration symptoms may be evident 6= Unspecified intermediate values correspond to intermediate percentages of damage 7= Approximately 50% of the hypocotyl and root tissues covered with lesions combined with considerable softening, rotting, and reduction of the root system 8= Unspecified intermediate values correspond to intermediate percentages of damage 9= Approximately 75% or more of the hypocotyl and root tissues affected with ad |
|
|
Halo blight on leaves in field |
HBFL |
1-9 |
1= No visible disease symptoms 2= Unspecified intermediate values correspond to intermediate percentages of affected areas 3= Approximately 2% of the leaf surface area covered with round lesions. Very slight systemic chlorosis may be evident 4= Unspecified intermediate values correspond to intermediate percentages of affected areas 5= Approximately 5% of the leaf surface area covered with round lesions of about 5 mm in diameter. Limited systemic chlorosis may be present on growing points 6= Unspecified intermediate values correspond to intermediate percentages of affected areas 7= Approximately 10% of the leaf tissues affected either by lesions or by the resulting chlorosis. Limited leaf distortion is presented 8= Unspecified intermediate values correspond to intermediate percentages of affected areas 9= 25% or more of the leaf tissues affected by lesions and chlorosis. S |
|
|
Rust on leaves in field |
RUSTFL |
1-9 |
1= Highly resistant: no visible rust pustule present (immune) 2= Unspecified intermediate values correspond to intermediate percentages of affected areas. 3= Resistant: presence of only a few and generally small pustules on most plants that cover approximately 2% of the foliar area 4= Unspecified intermediate values correspond to intermediate percentages of affected areas. 5= Intermediate: presence of generally small or intermediate pustules on all plants that cover approximately 5% of the foliar area 6= Unspecified intermediate values correspond to intermediate percentages of affected areas. 7= Susceptible: presence of mostly large pustules often surrounded by chlorotic halos that cover approximately 10% of the foliar area 8= Unspecified intermediate values correspond to intermediate percentages of affected areas. 9=Highly susceptible: presence of large and very large pustules with chlorotic halos, that c |
|
|
Pythium spp. in field |
PYTHF |
1-9 |
1= No visible disease symptoms 2= Unspecified intermediate values correspond to intermediate percentages of damage 3= Light discoloration either without necrotic lesions or with approximately 10% of the hypocotyl and root tissues covered with lesions 4= Unspecified intermediate values correspond to intermediate percentages of damage 5= Approximately 25% of the hypocotyl and root tissues covered with lesions but tissues remain firm with deterioration of the root system. Heavy discoloration symptoms may be evident 6= Unspecified intermediate values correspond to intermediate percentages of damage 7= Approximately 50% of the hypocotyl and root tissues covered with lesions combined with considerable softening, rotting, and reduction of the root system 8= Unspecified intermediate values correspond to intermediate percentages of damage 9= Approximately 75% or more of the hypocotyl and root tissues af |
|
|
Bean Common Mosaic Necrosis Virus |
BCMNV |
1-5 |
1=M=Mosaic, susceptible 2=N=Necrotic reaction, has I gene 3=O=No symptoms, has recessive resistance 4=L=Local lesions, has protected I gene 5=V=Variable |
|
|
Number of effective nodules in bush bean |
NENBB |
1-9 |
1=Higher of 80 nodules 2=From 41 to 80 nodules of large size 3=From 41 to 80 nodules of normal or small size 4=From 21 to 40 nodules of large size 5=From 21 to 40 nodules of normal size 6=From 21 to 40 nodules of small size 7=From 10 to 20 nodules of normal size 8=From 10 to 20 nodules of small size 9=Less of 10 nodules |
|
|
Number of effective nodules in climbing bean |
NENCB |
1-9 |
1=Higher of 240 nodules 2=From 121 to 240 nodules of large size 3=From 121 to 240 nodules of normal or small size 4=From 61 to 120 nodules of large size 5=From 61 to 120 nodules of normal size 6=From 61 to 120 nodules of small size 7=From 30 to 60 nodules of normal size 8=From 30 to 60 nodules of small size 9=Less of 30 nodules |
Sample RCBP field trial layout